Comparing the outcomes of two classification models (WIP)
hypotheses-testing
We consider the following problem: A prediction model partitions a population into: very high (vh), high (h), medium (m) and low (l) risk. The very high group is much smaller than the low risk group (typically 50 times smaller). With the given model some actions are taken on the very high and high groups. The objective of the actions is to lower the risk of those groups.
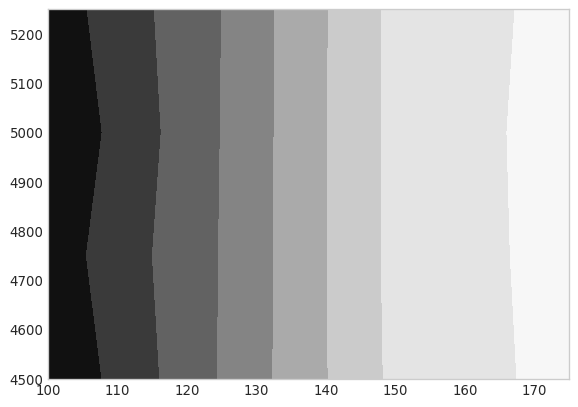
The metric to be used to measure the performance is the fraction of accurate predictions in the high risk group over the fraction of accurate predictions on the low risk group \[ L = \frac{p_{vh}}{p_{l}} \]
We consider our algorithm works if \(L\) is large. The minimum requirement is that \(L>1\). Our goal is to find sample sizes \(n_{1}\) and \(n_{2}\) so that we can assert with a large confidence that the minimum requirement is met.
To measure the performance we set aside a fraction of the members of the very high and low risk groups. In this setting the very high risk group is small and also the most important one because it is the one where presumably we can have a higher impact with our actions. Hence we would like for the sample this group to be as small as possible.
Naive Monte Carlo method
We will implement the following procedure. For a given pair \(\left(p_{l}, p_{vh}\right)\) .
- Assume values for \(n_{l}\) and for \(n_{vh}\).
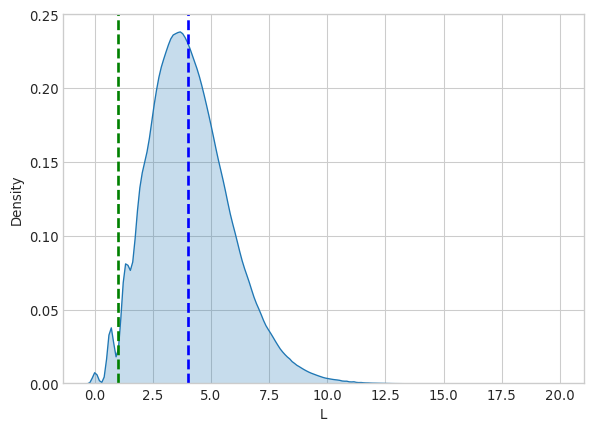
- Generate a sample of \(L\)
- Estimate \(\mathbb{P}\left( L <= 1 \right)\)
The probability that L is less than or equal to 1 is 0.016